
UPenn Professor Jeffrey Morris just sent us a major gift by Steve Kirsch for Steve Kirsch’s Newsletter
Professor Morris wrote an article that has two tables showing that the death rate after vaccination is not flat. More confirmation that the vaccines are causing huge numbers of excess deaths.
Executive Summary
Data in two charts in UPenn Professor Jeffrey Morris’s article show clearly that the vaccines are causing excess deaths. The shot goes in and the death rate starts climbing. Do it again… shot goes in, death rate starts going up, but this time by a smaller amount. That’s dose dependenc! If the vaccine is perfectly safe, nothing should happen to the death rate on each dose: it should be virtually identical.
This means that the VAERS spikes in deaths are not from “overreporting” as the CDC and Professor Morris have erroneously claimed: these are real excess deaths.
These people need to get out of their ivory tower and talk to real doctors who are being inundated with injuries and deaths. The data we observe doesn’t support the claims that the vaccines are safe and it is just “overreporting.”
Why would everyone instantly decide to overreport just the COVID vaccine and not any other vaccine? Nobody ever explains that and provides evidence. I show that the evidence shows that the COVID vaccines are actually 5X underreported!
In this article, I will explain what the data that Morris highlighted shows and also address each of Morris’s attacks on this article.
Introduction
Check out this article written by UPenn Professor Jeffrey Morris. His specialty is biostatistics, but in his spare time, he writes articles trying to debunk my work and the work of others who attempt to spread the truth.
His article contains a hidden gift to me that he never noticed.
Check out these two charts below and look at the column where the red marking is. See how the numbers go up? … and up? … and up? This column is the daily number of deaths.
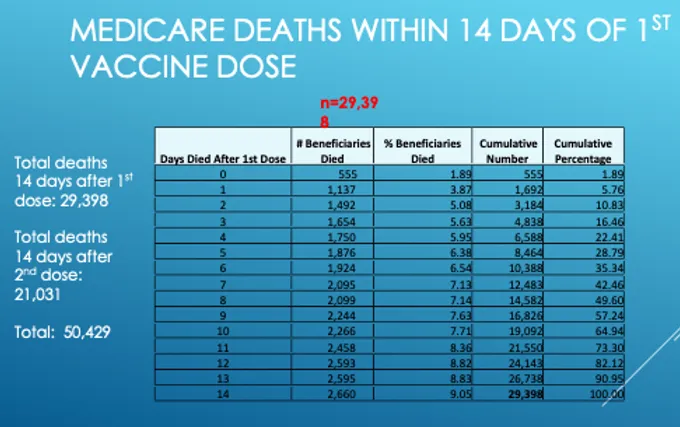

Key point:
If vaccination is a non-event, all the numbers in this column should be roughly the same since death is a random event.
Instead, the death numbers per day are pretty much monotonically increasing over time (with one exception in the second chart). For example, on Day 1, we have 1,137 deaths but on day 14, we have 2,660 deaths. That’s a factor of 2.3X growth in just 14 days!!! That’s a HUGE increase. Morris never explain how that can happen in a safe vaccine.